SigNoz
SigNoz is the bundled observability stack. In the provided environment it is enabled by default, so a normal terragrunt run --all apply installs the SigNoz chart, the Kubernetes infrastructure integration, a Traefik Ingress, and the dashboard importer.
Configure or disable it
SigNoz is configured from infra/<env>/env.hcl. That is where you control whether it is enabled, which hostname it uses, chart versions, and the size of its persistent volumes.
To skip SigNoz in a new environment, set the SigNoz enabled flag to false before the first apply:
If SigNoz is already installed, destroy the signoz unit before flipping the flag. Once enabled = false, Terragrunt excludes that unit from future runs.
Warning
Destroying the signoz unit deletes the SigNoz namespace and its persistent volumes. Any telemetry stored in SigNoz is lost unless you have backed it up elsewhere.
Tune chart values
Use helm_set in the SigNoz block in infra/<env>/env.hcl for extra values for
the signoz chart. Use k8s_infra_helm_set for the separate k8s-infra chart.
Both maps have a matching sensitive form.
See Helm value overrides for examples, limits, and the required git hook.
Resize the persistent volumes
SigNoz keeps state on three PersistentVolumeClaims. Their sizes are exposed in infra/<env>/env.hcl so each environment can tune capacity without forking the module.
| PVC | Purpose |
|---|---|
clickhouse |
Telemetry data (traces, metrics, logs). The only PVC that grows with usage. |
zookeeper |
ClickHouse coordination state. |
signoz |
Internal SQLite database for dashboards, users, and alerts. |
Hetzner block storage is grow-only and has a 10 GiB minimum per volume, so values below 10 GiB are silently rounded up at provision time. Start small if in doubt; see Persistent Volumes for the storage class details and operational caveats.
Access the UI
The UI is exposed through Traefik at the SigNoz host configured in env.hcl.
The initial user email comes from the environment's operator email. The initial password is generated during apply and stored in the signoz-initial-admin-secret Kubernetes Secret:
kubectl -n signoz get secret signoz-initial-admin-secret \
  -o jsonpath='{.data.email}' | base64 -d; echo
kubectl -n signoz get secret signoz-initial-admin-secret \
  -o jsonpath='{.data.password}' | base64 -d; echo
After the first login, change the password in the SigNoz UI. The dashboard importer uses its own service-account key, so changing the admin password later should not break future applies.
Resource expectations
SigNoz is useful, but it is not tiny. On small Hetzner nodes such as cx22 or cx23, ClickHouse and the collector can be memory hungry.
If SigNoz pods start getting OOMKilled, first consider adding worker capacity in agent_nodepools for that environment. Tune Helm resource values only once you know which component is actually constrained.
Send application telemetry
Applications running inside the cluster can send OpenTelemetry data to the bundled collector service.
For OTLP/HTTP:
For OTLP/gRPC:
These are in-cluster service endpoints. They are intentionally plain HTTP / gRPC, so most clients need insecure or no-TLS mode enabled.
A typical OTLP/HTTP setup looks like:
OTEL_EXPORTER_OTLP_ENDPOINT=http://signoz-otel-collector.signoz.svc.cluster.local:4318
OTEL_EXPORTER_OTLP_PROTOCOL=http/protobuf
For gRPC clients, use the gRPC host:port endpoint and enable the SDK's insecure option.
What is collected
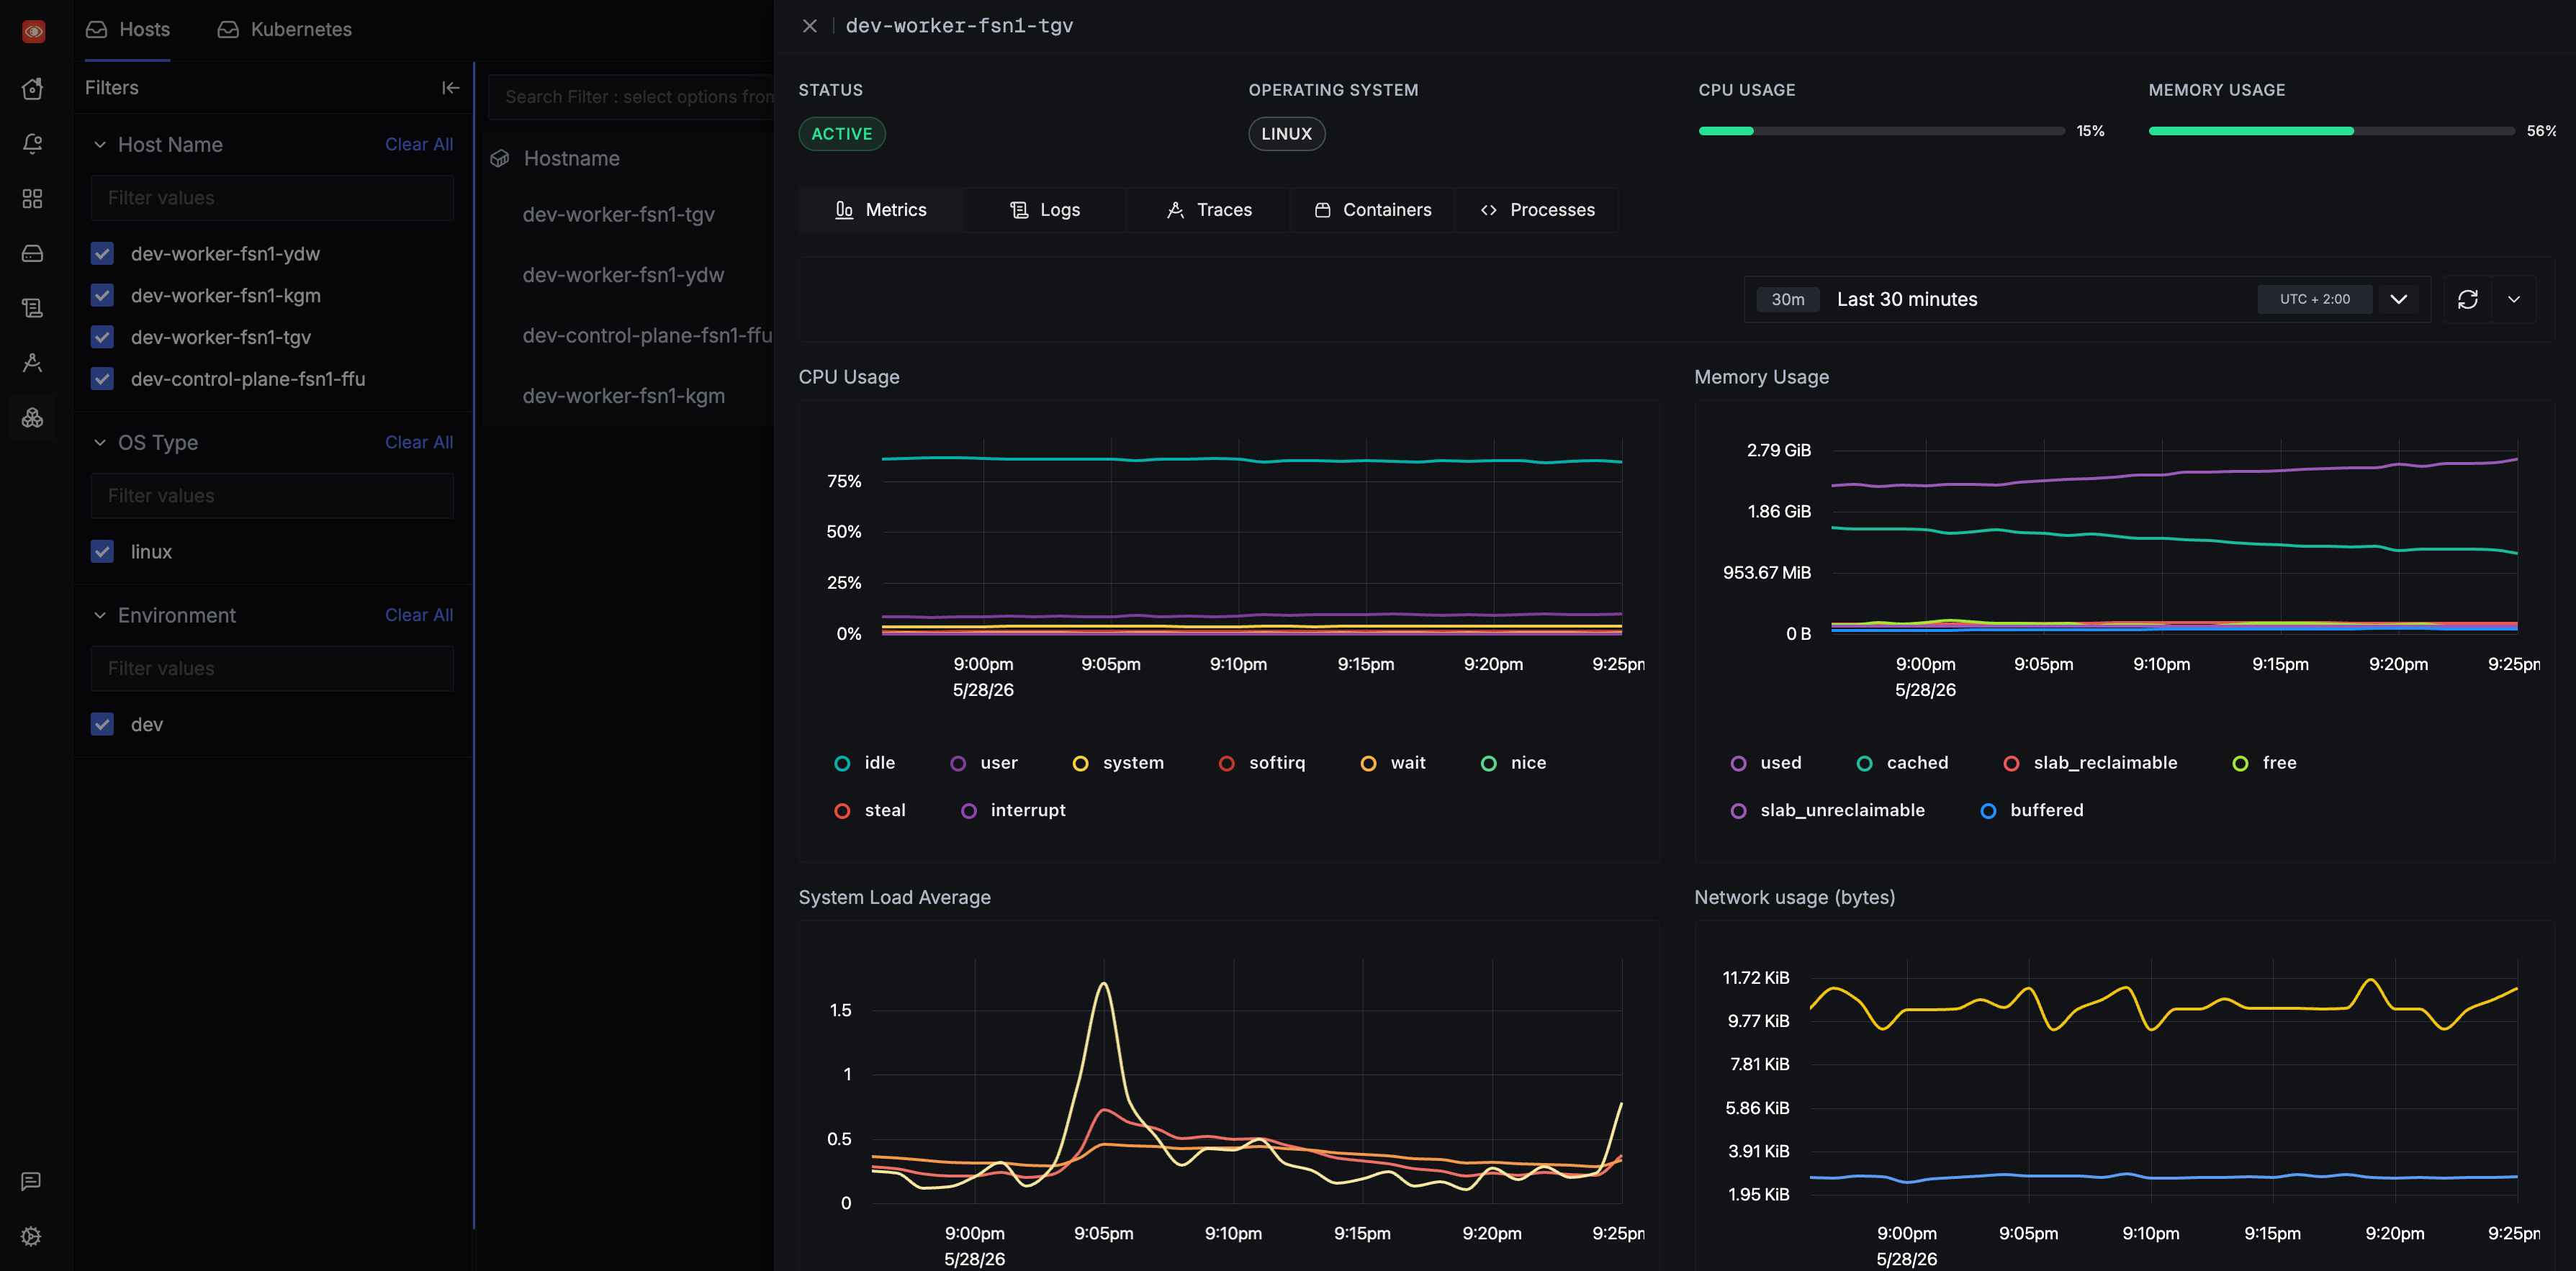
The bundled Kubernetes integration collects cluster infrastructure signals: host metrics, kubelet metrics, cluster metrics, Kubernetes events, logs, Kubernetes attributes, and Prometheus-style annotated targets.
That means workloads using common prometheus.io/* scrape annotations should be picked up without rewriting them specifically for SigNoz.
Bundled dashboards
Dashboard JSON files live in infra/modules/signoz/dashboards/. Terraform mounts them into the cluster and runs a post-install import Job after SigNoz is available.
The bundled dashboards are mostly examples and starting points. They are useful for seeing how SigNoz dashboard JSON is structured and how cluster queries are put together.
For day-to-day cluster exploration, start with SigNoz's Infrastructure tab. It is usually better for understanding nodes, pods, logs, events, and resource pressure than jumping straight into the imported dashboards.